Engineering Demand Parameter - Decision Variable Functions for seismic design and assessment
Apr 20, 2025
Seismic Risk Assessment: An Introduction to Vulnerability Functions and Storey Loss Methodologies
Effective seismic risk assessment is fundamental to understanding and mitigating earthquake impacts on communities. By quantifying potential consequences, we can identify vulnerabilities and prioritise risk reduction measures strategically. Vulnerability functions play a critical role in this process by providing quantitative measurements of structural performance during seismic events, illustrating how damage-related losses vary with shaking intensity.
When integrated into comprehensive risk assessment models, these functions enhance our understanding of potential earthquake impacts across buildings, infrastructure, and populations. This integration enables more informed decision-making regarding retrofitting priorities, resource allocation, emergency planning, and building regulations in earthquake-prone regions.
The field has evolved substantially over recent decades, with Calvi et al. (2006) documenting key methodological developments that allow analysts to numerically model building behaviour and estimate seismic vulnerability. Further refinements emerged during the late 2000s and early 2010s, culminating in comprehensive guidelines consolidated by D'Ayala et al. (2014). A notable approach within these guidelines involves representing entire building structures through equivalent single-degree-of-freedom (SDOF) systems—offering exceptional computational efficiency with reasonable accuracy trade-offs for regional assessments. Silva et al. (2019) expanded these considerations to address increasingly diverse vulnerability modelling requirements.
This blog presents an alternative methodology based on storey loss functions (SLF)s, which link engineering demand parameters (EDP)s to economic losses or decision variables (DV)s at the building storey level. Our approach (Shahnazaryan et al., 2021) builds upon the storey loss estimation framework by Ramirez and Miranda (2009), developing a tool for creating user-specific SLFs. The tool facilitates automated production of SLFs through regression analysis using random sampling of component damage states and costs, including damage correlation among components.
Implementation begins with identifying building characteristics and creating a comprehensive damageable component inventory that includes structural elements, non-structural components, and contents. Components are then categorised into performance groups based on EDP sensitivity, with fragility and consequence functions often adapted from established sources like FEMA P58 (2012). For three-dimensional analysis, the framework must be applied separately for orthogonal directions, though more advanced methods may be necessary if significant interactions exist between seismic effects. This classification approach enables detailed loss disaggregation, helping identify key contributors to economic loss as discussed by O'Reilly and Shahnazaryan (2024). After Monte Carlo simulations and cost computations, regression analysis identifies the fitted SLFs. The resulting tool features an intuitive graphical interface designed to simplify SLF creation for comprehensive seismic assessment. Finally, the generated functions may be generalised for a building typology and used in portfolio loss assessment.
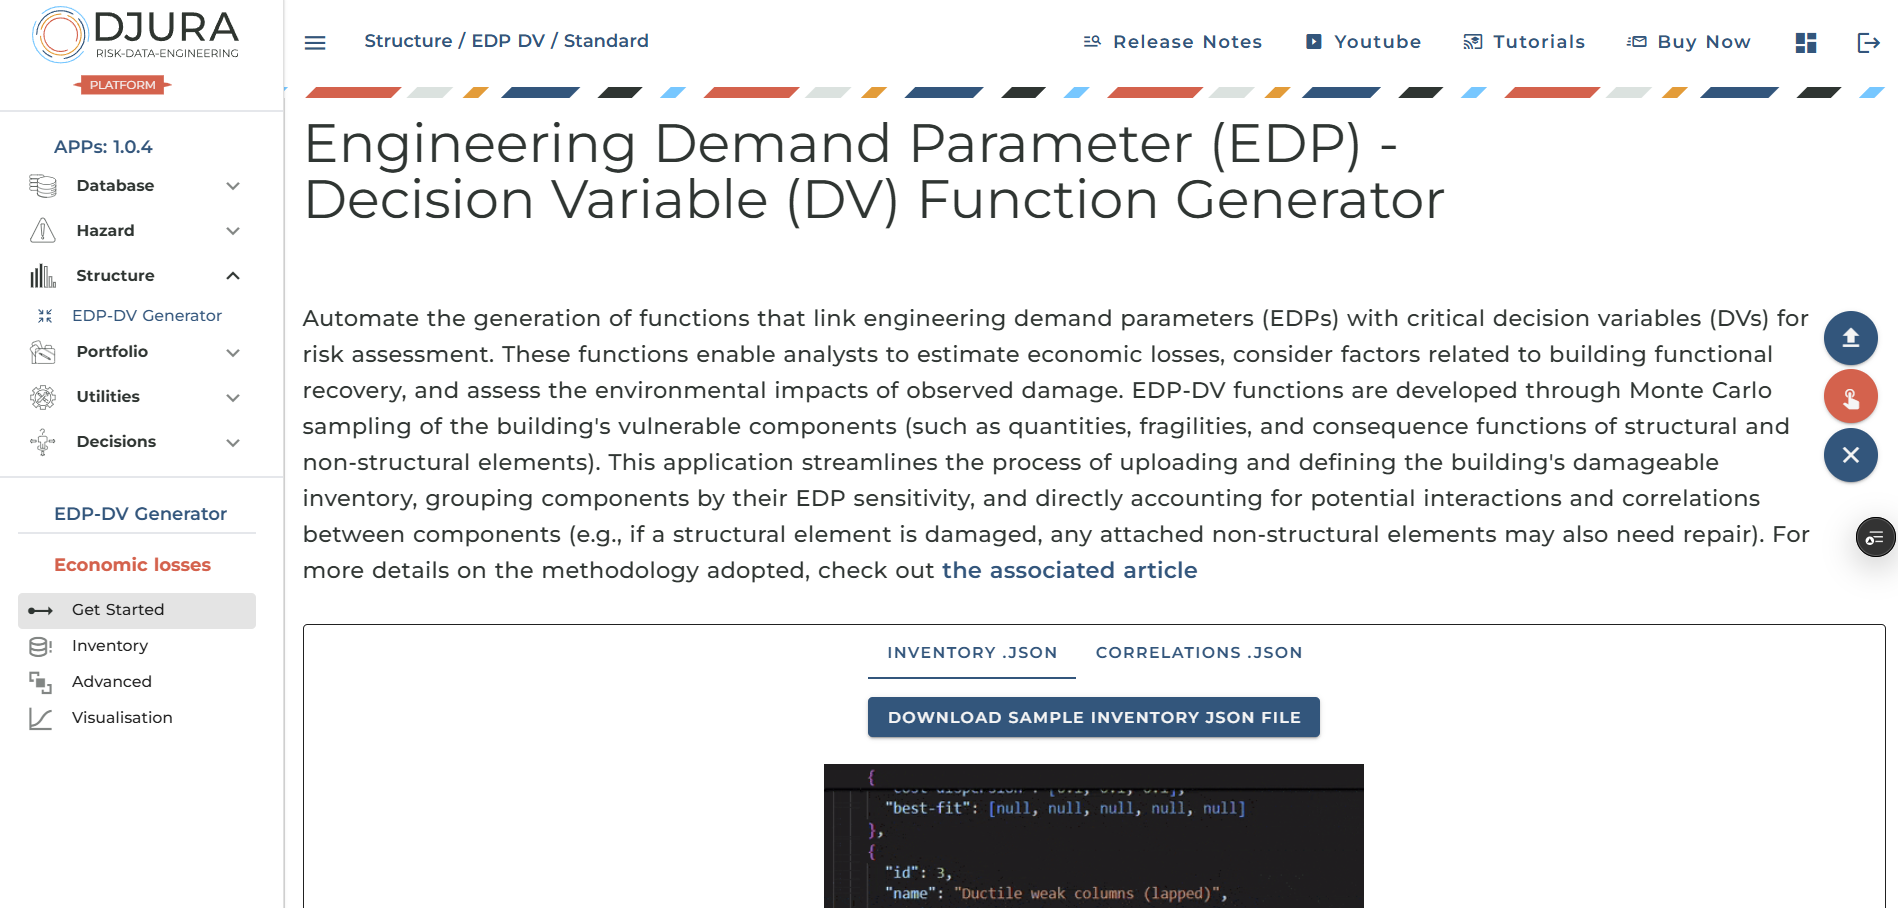
EDP-DV Function Generator
Let’s get started!
EDP-DV function generator automates the connection between engineering demand parameters and decision variables, which are generally cost metrics, for a building risk assessment. This application generates functions that estimate economic losses, can be used for estimating functional recovery factors, and environmental impacts from observed damage.
Users may upload and define, or directly create their building’s damageable inventory and group components by engineering demand sensitivity. It can be used to account for interactions between damages of different components.
In essence it is a handy tool to make risk assessment easy by providing comprehensive analysis from a single interface.
Visit our get started page to download sample input data for testing the software or use it as a foundation for creating wer own custom dataset. Alternatively, we can proceed directly to inventory creation, where we've pre-generated default input data as a convenient starting point for wer project.
On the get started page we may download a sample input data to test out the software or use it as a basis for creating wer own input data. Alternatively, we may just move forward to the inventory creation, where a default input data was pre-generated as a starting point.
Now, let’s go through a EDP-DV function generation using this approach.
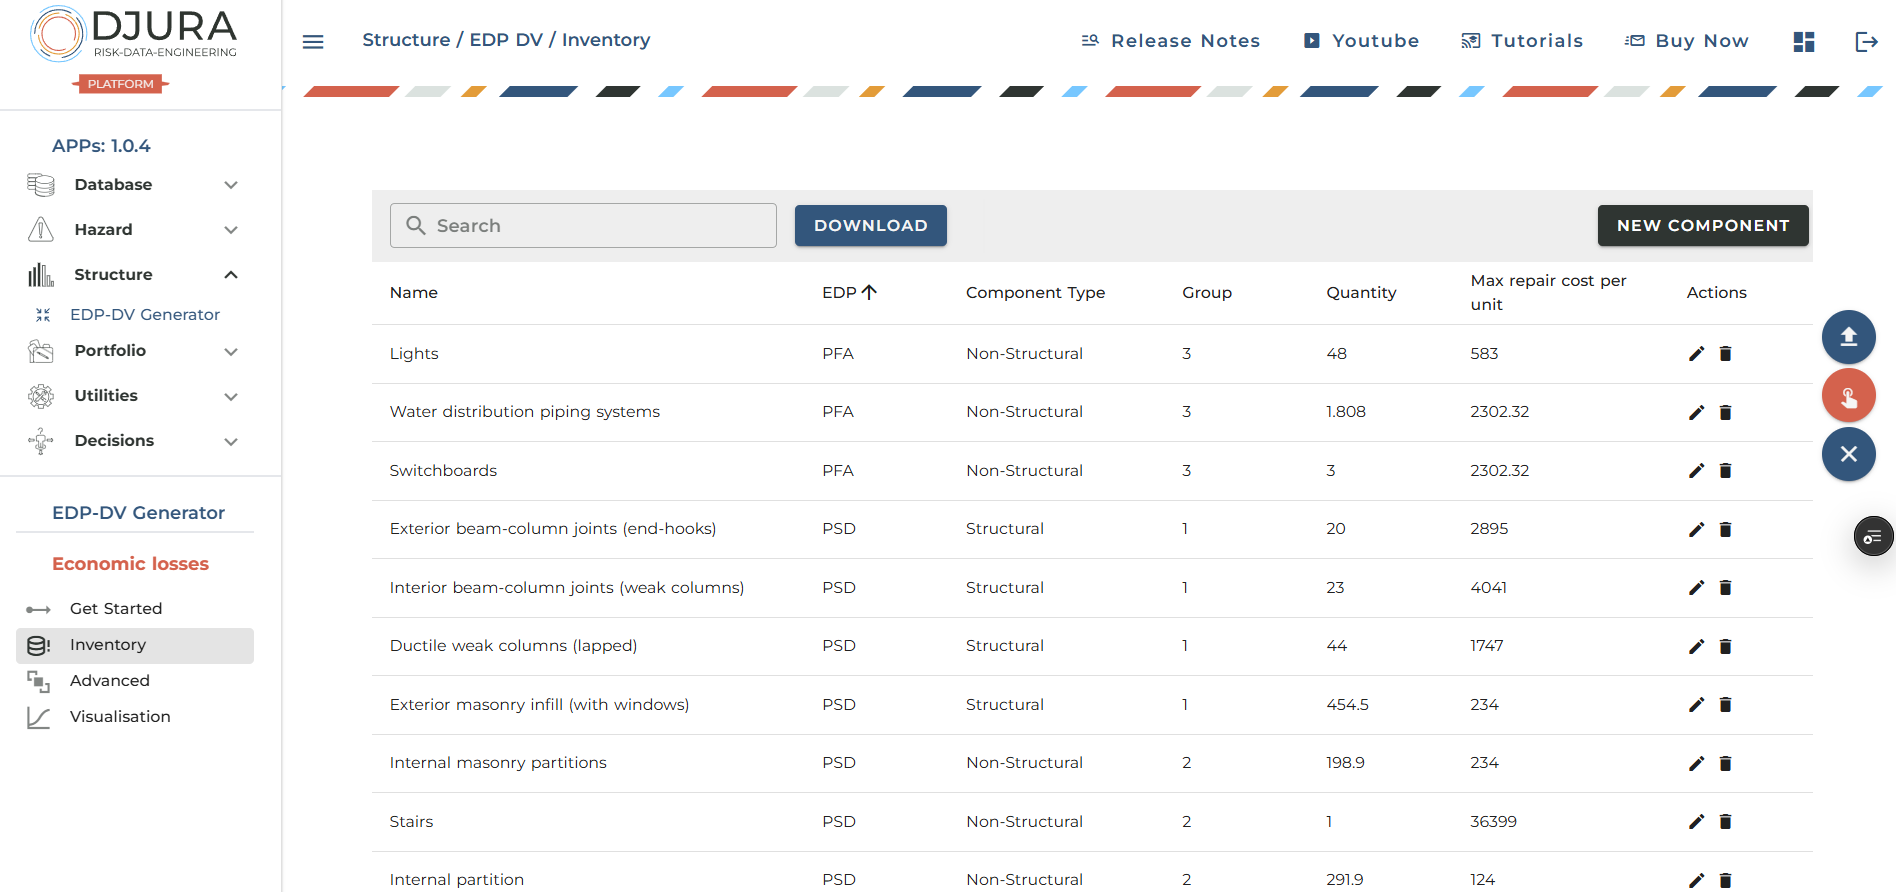
Defining Component Inventory
Generation of EDP-DV or SLF functions rerquires a definition of a component inventory.
Element inventory is defined in a table format here. we may perform create, read, update, and delete operations here.
Also, non-structural, structural components or contents are defined along with their quantities and demand parameter sensitivity. we may choose to further categorise the elements into different groups for even more granular visualisations or post-processing. For our specific example, and by default we have 3 performance groups (the number of performance groups is not limited and depends on wer needs and application):
- 1. Structural PSD-sensitive components
- 2. Non-structural PSD-sensitive components
- 3. Non-structural PFA-sensitive components
Now, let’s go ahead and perform some operations.
First, let's add a new damageable component. This will be a Heating distribution system, which is going to be a peak floor acceleration (PFA) sensitive non-structural component. For example, this is a component with a key ID of D2022.011a in FEMA P58-3, the unit of measure of which is per 250m, and the quantity is assumed 1.904 for our study building (for a more detailed example refer to Shahnazaryan et al., 2021). It is assgned a performance group 3 corresponding to non-structural PFA-sensitive components. Additionally, we need to define damage states for the component, which are essentially fragility functions of the component and associated repair costs in any unit of measure (e.g., US dollars, Euros). Best Fit (Cost) is the function that describes the cost distribution. While the median demand (in this case in the unit of PFA) and dispersion are the parameters of a longormal distribution.
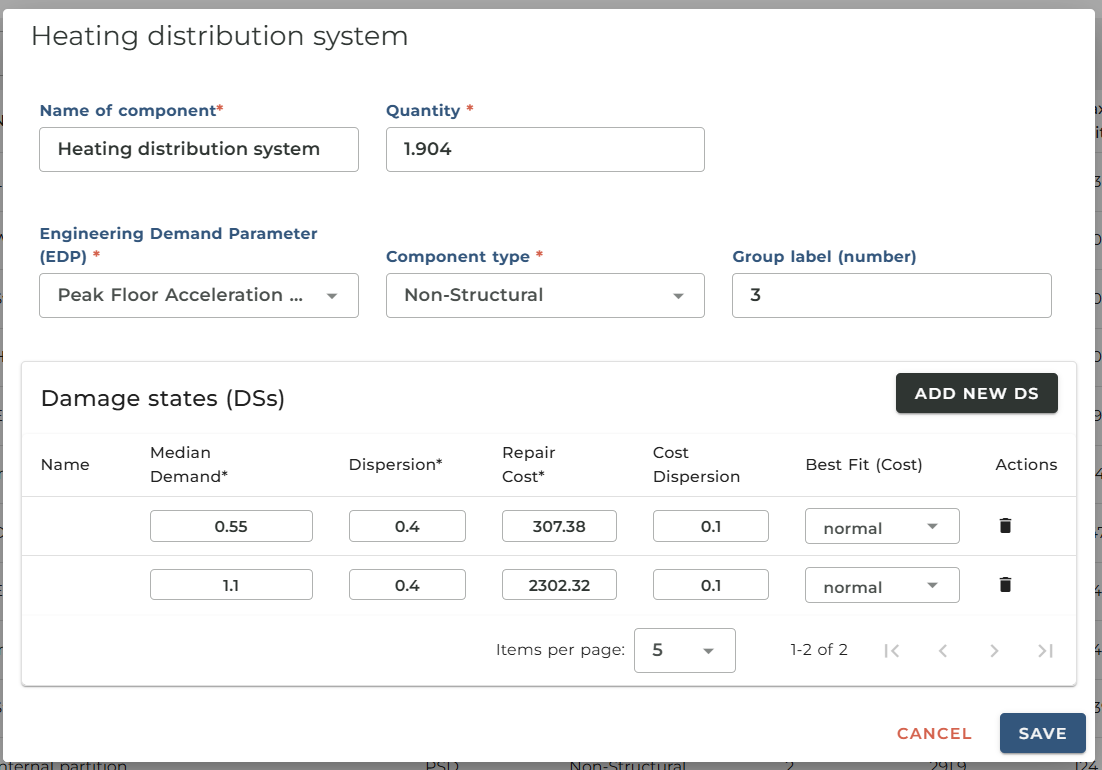
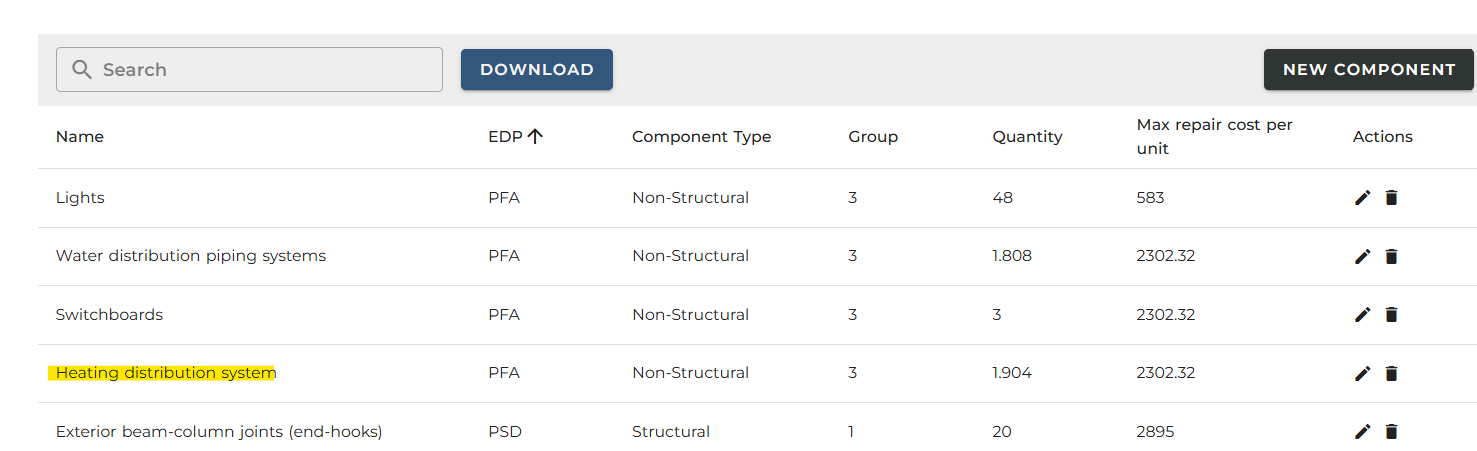
Once, the new component is added, it will appear in the Component Inventory table.
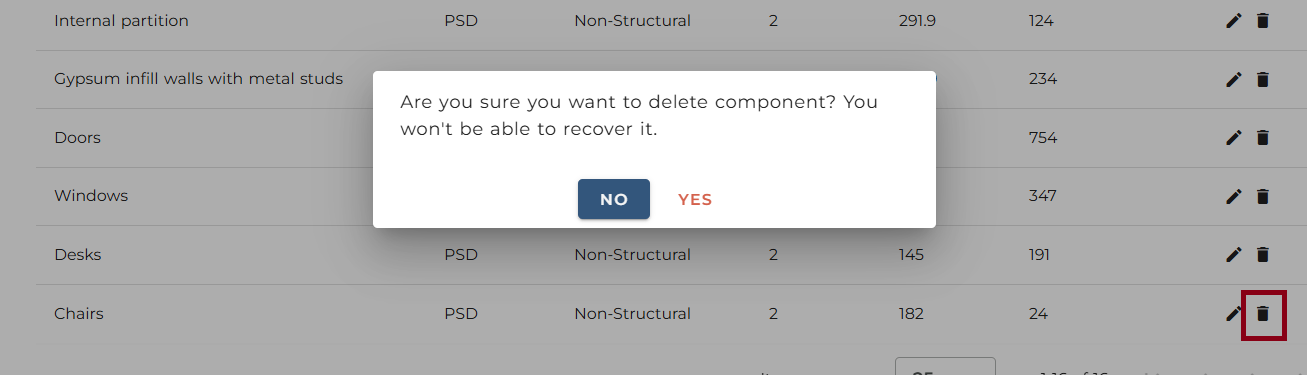
We might choose to delete components that we don’t need. For example, let's remove the Chairs component. For that simply click the Bin button next to the unnecessary component.
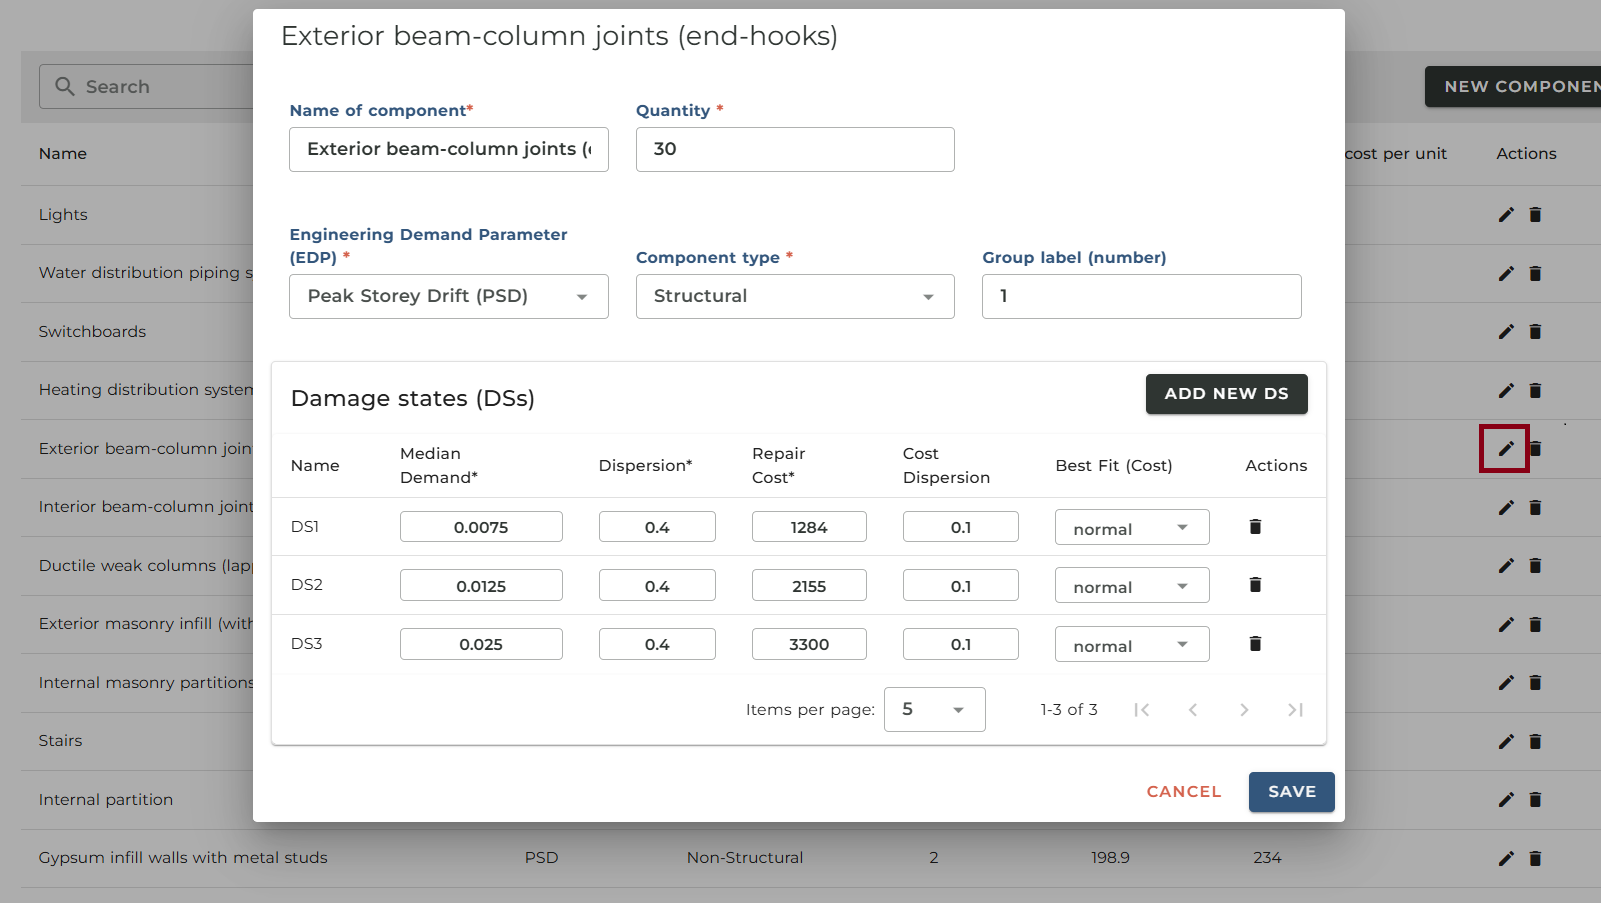
Finally, we may want to Edit components that have been incorrectly defined or for any other reason.
Let’s edit the Exterior beam-column joints by increasing its quantity to 30, and increasing the repair cost and median demand for 3rd damage state of the component.
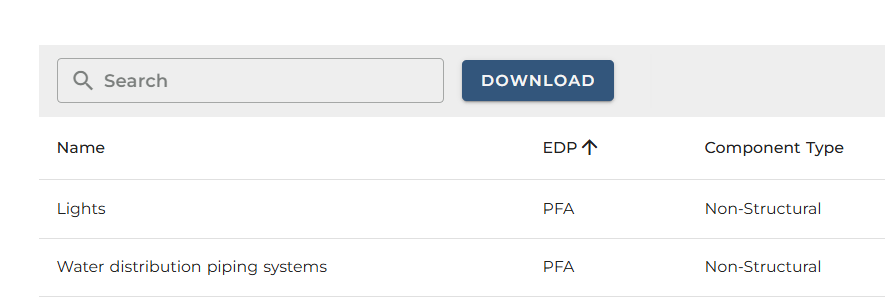
Once we are happy with our input or at any time of the project, we may choose to download the inventory which may be used during wer own assessment or for future reference.
For example, we may reupload the inventory at a different time using the upload component inventory button.
Defining Correlations Matrix
Structural and non-structural components sensitive to the same EDP can be grouped to account for potential correlations. This approach addresses scenarios where repair of a damaged structural component necessitates removal of undamaged non-structural elements that might impede access. As Ramirez and Miranda (2009) demonstrated, ignoring these dependencies can lead to double-counting of repair costs. For example, when both columns in a moment-frame building and internal partitions sustain damage, repair costs for dependent components might be incorrectly tallied twice.
For independent components, damage states (DSs) follow sequential occurrence patterns and are mutually exclusive, with probabilities summing to 100% (will be updated to include more complex scenarios in future iterations of the software). For dependent components, damage in one component can trigger specific damage states in another. For instance, at a given EDP value, if a causation component reaches DS3, its dependent component automatically enters DS2, even if its individual fragility parameters wouldn't indicate damage. Similarly, if the causation component is in DS2, the dependent component enters DS1. This dependency framework ensures accurate representation of physical relationships between components and prevents cost estimation errors in seismic assessment.
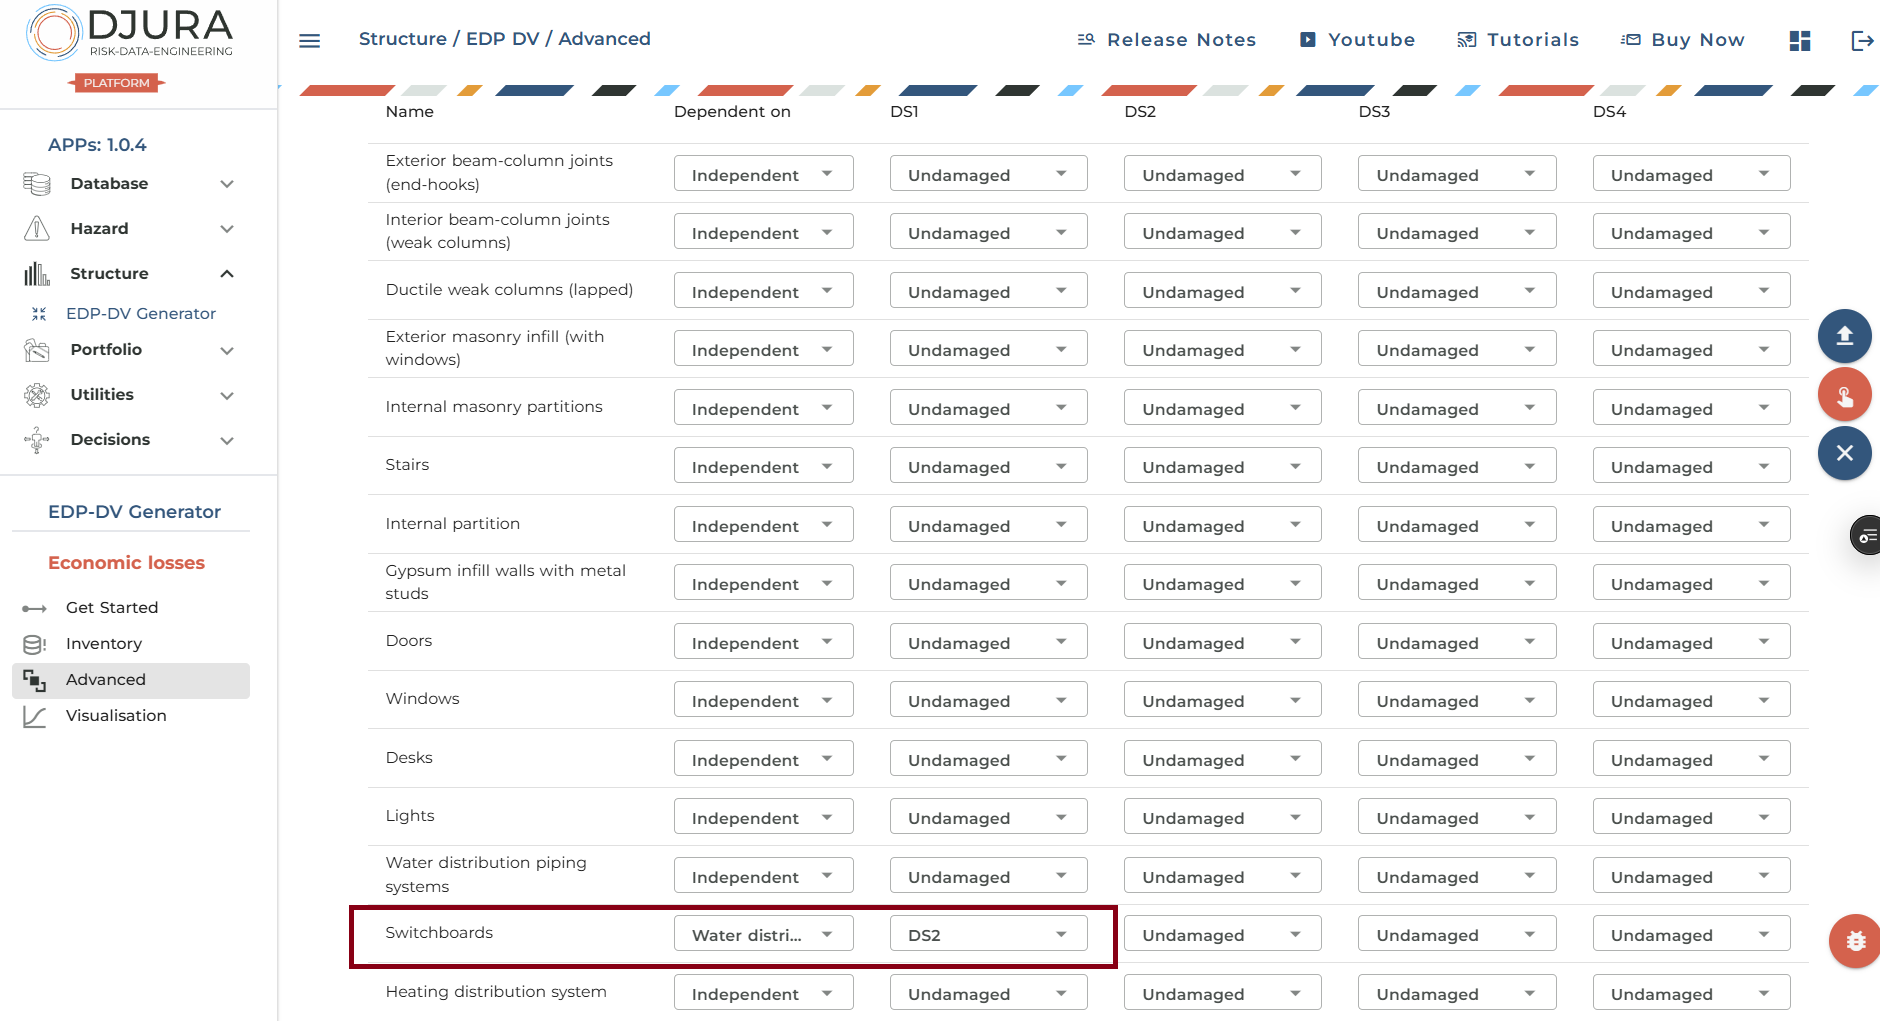
As a result, we may choose to set up correlations between different components. For that purpose we have to switch to the Advanced web page.
Why would we need this? Well, for example, imagine a scenario, where switchboards are not damaged after an earthquake, but the Water distribution piping system has been damaged as a result. In reality, the switchboards would be affected by the leakage, meaning we would like to consider such a scenario during wer loss assessment.
In that case, we may want to select Switchboards dependent on Water distribution piping system. Hence, let’s define the relationship. In the Dependent on item column for switchboards select Water distribution piping system, while in DS1 column we have to select 2nd damage state. This means, if the piping system is in DS1, then switchboards are in DS2, which is its final state, meaning that they need to be completely replaced and would incur full costs.
Finally, we click on the Save Matrix button.
Important to note, correlations may be defined between components of the same EDP sensitivity only!
Defining Advanced Inputs
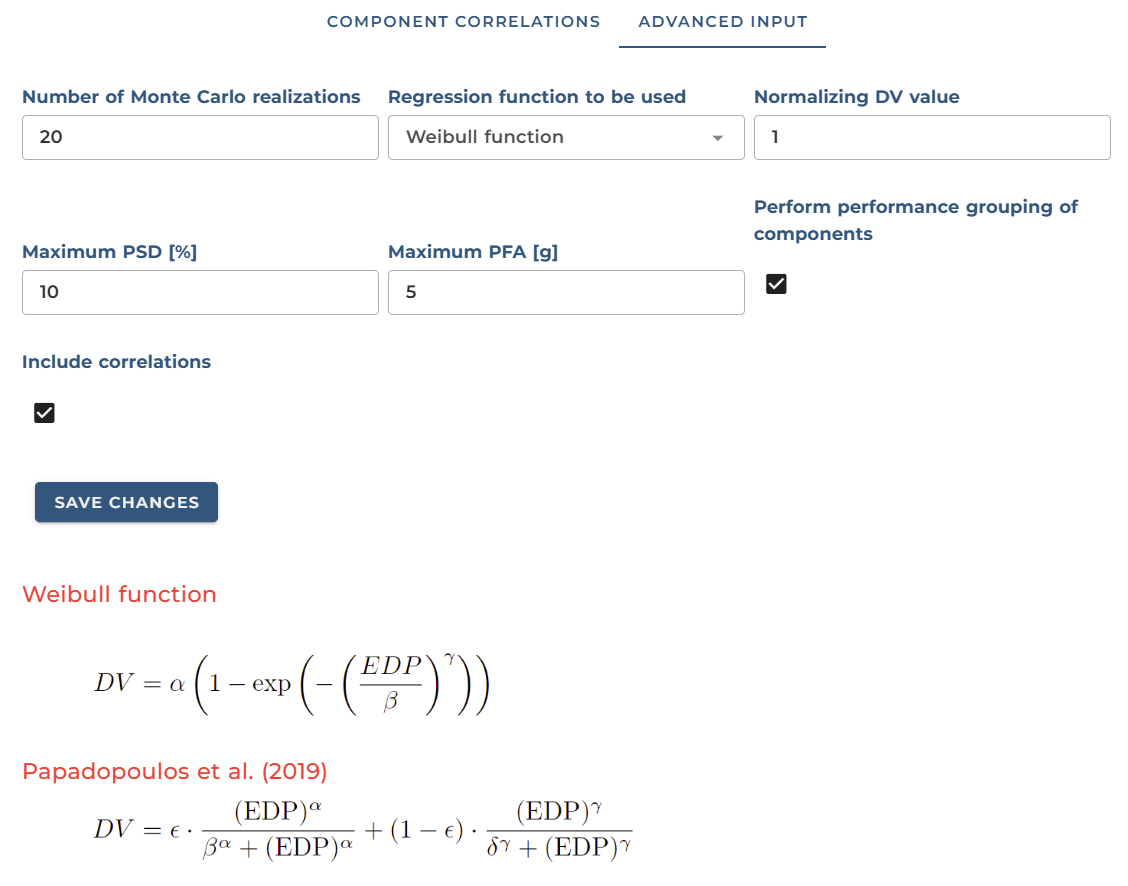
Before generating EDP-DV functions, there are several advanced optional input parameters that can be configured.
In the Advanced tab, more advanced parameters may be selected, for example we may increase the number of monte carlo simulations to 40, choose a different regression function for fitting, include correlations or not, and other parameters.
The current available advanced input parameters include:
- Number of Monte Carlo realisations
- Regression function to be used (currently has two options)
- Normalising DV value - primarily necessary for visualsiations and post-processing
- Maximum PSD % - PSD limit for visualisation and post-processing
- Maximum PFA g - PFA limit for visualisation and post-processing
- Perform performance grouping of components
- Include correlations
Performing EDP-DV Function Generation and Data Visualisation
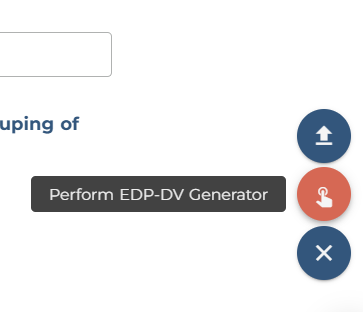
Finally, once we are happy with the input we may perform EDP-DV generation by clicking the perform generation button on the right side of the window.
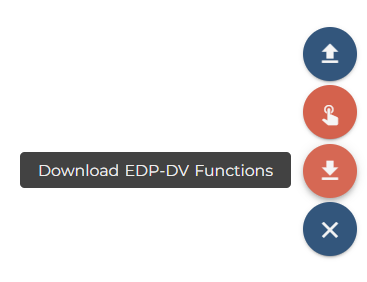
Once generation is complete, a new button will appear for downloading the outputs.
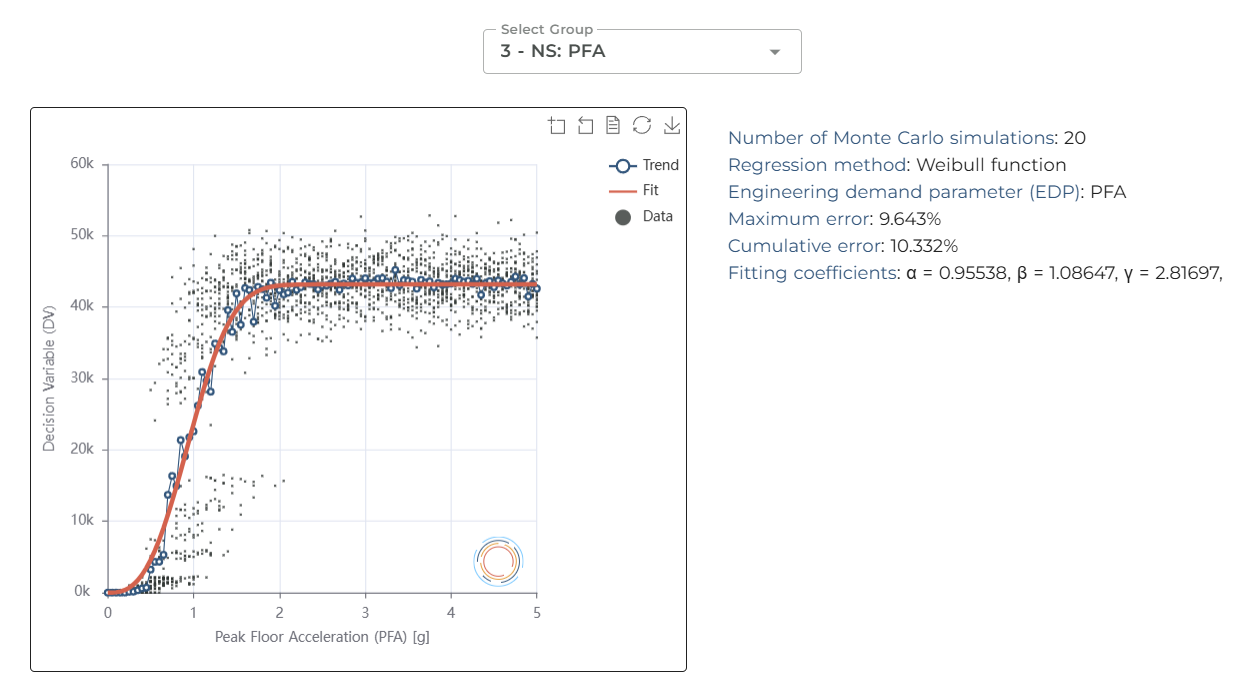
Finally, we can move on to visualisations, where assessment parameters are available as well as the plots relating the engineering demand parameter to the decision variable, which can be the cost in Euros or any other currency, performance groups can be selected to have disaggregated visualisations for your comfort, below you may see the plots for two performance groups.
For Example, at a PSD of 2% given our input inventory, we are expected to incur around 300'000 Euros for structural components. While for 1g PFA we are expected to have 25'000 Euros for non-structural components. Those are numbers specific to our case example, and are not meant to represent a real building.

If at any point you decide to clear the data which includes both inputs and outputs to default values, you may press the X sticky button.
Conclusion
Summary
This blog presents an advanced methodology for performing seismic loss assessment using storey loss functions (SLF)s, which establish direct relationships between engineering demand parameters (EDP)s and decision variables (DVs). We demonstrate a streamlined and efficient process for generating these EDP-DV functions that effectively addresses several limitations of traditional approaches.
Our tool successfully incorporates component correlation while eliminating the common issue of double-counting repair costs encountered in conventional methodologies. The EDP-DV functions enable precise vulnerability estimation at each individual storey, ultimately producing a comprehensive vulnerability function for the entire building.
This approach represents a significant advancement over the widely-used fragility and damage-to-loss ratio-based methods. Despite providing greater detail and precision, the SLF-based approach requires minimal additional computational resources or effort. By directly considering both peak storey drift (PSD) and peak floor acceleration (PFA) demands throughout the building, the method allows for:
- More detailed assessment of non-structural elements
- Precise identification of which performance groups and building locations contribute most significantly to expected losses
The enhanced granularity of this method supports more informed decision-making while maintaining practical implementation requirements.
Future Updates
We have tested this and are adding more features and flexibility so please let us know if we have specific needs.
We plan to further improve the regression functions as well as add more flexibility for inclusion of functional recoveries directly, and consideration of environmental impacts.
This video summarises how to use the UI for the engineering demand parameter and decision variable generation to be used during design and assessment of buildings.
This tool will also be callable via API directly from Python or Matlab from wer local machine so when we get comfortable, we can integrate this tool directly within wer workflow with a single command.
Stay Tuned
Get in touch if we would like to use this service by visiting the website, or dropping us an email. Stay tuned for other videos and contact us for more information.
References
- Gian Michele Calvi, Rui Pinho, Guido Magenes, J. J. Bommer, L. F. Restrepo-Velez, and ´Helen Crowley. Development of seismic vulnerability assessment methodologies over the past 30 years. ISET Journal of Earthquake Technology, 43(3):75–104, 2006.
- D D’Ayala, A Meslem, Dimitrios Vamvatsikos, Keith Porter, Tiziana Rossetto, and Vitor Silva. Guidelines for Analytical Vulnerability Assessment of Low/Mid-Rise Buildings. Technical report, GEM TECHNICAL REPORT 2014-12 V1.0.0, 2014.
- Vitor Silva, Sinan Akkar, Jack Baker, Paolo Bazzurro, Jose Miguel Castro, Helen Crow- ´ ley, Matjaz Dolsek, Carmine Galasso, Sergio Lagomarsino, Ricardo Monteiro, Daniele Perrone, Kyriazis Pitilakis, and Dimitrios Vamvatsikos. Current Challenges and Future Trends in Analytical Fragility and Vulnerability Modeling. Earthquake Spectra, 35(4):1927–1952, nov 2019. ISSN 8755-2930. doi: 10.1193/042418EQS101O. URL http://journals.sagepub.com/doi/10.1193/042418EQS101O.
- Davit Shahnazaryan, Gerard J. O’Reilly, and Ricardo Monteiro. Story loss functions for seismic design and assessment: Development of tools and application. Earthquake Spectra, 37:2813 – 2839, 2021. URL https://api.semanticscholar.org/ CorpusID:237774879.
- Ramirez CM and Miranda E (2009) Building-specific loss estimation methods & tools for simplified performance-based earthquake engineering. Blume Center report, Blume Center, Stanford University, Stanford, CA, May.
- FEMA. FEMA P58-3. Seismic Performance Assessment of Buildings Volume 3 - Performance Assessment Calculation Tool (PACT). Technical report, Federal Emergency Management Agency, Washington, D.C., 2012.
- Gerard J O’Reilly and Davit Shahnazaryan. On the utility of story loss functions for regional seismic vulnerability modeling and risk assessment. Earthquake Spectra, 40(3): 1933–1955, 2024. doi: 10.1177/87552930241245940.